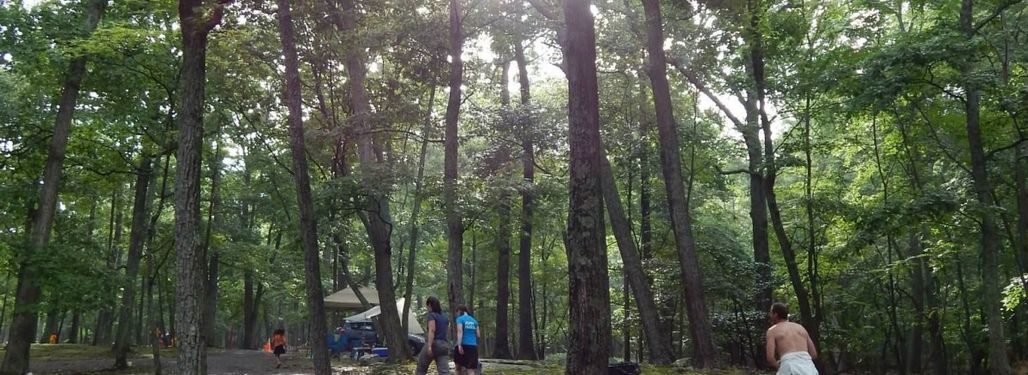
Berkely Springs, WV

2016 Cacapon 12 Hour Challenge Race Results (12 Hours )
| Overall Place |
Division Place |
||
|---|---|---|---|
| 1 | 1 |
Mary Beth Strickler
F
40-49
|
50.1 |
| 2 | 1 |
Robbie Jenkins
M
30-39
|
50.05 |
| 3 | 2 |
Josh Wadlington
M
30-39
|
50.03 |
| 4 | 2 |
Sophorn Choup
F
30-39
|
50 |
| 5 | 3 |
Ashley Etue
F
30-39
|
45.1 |
| 6 | 3 |
Bryan Fluke
M
40-49
|
45.07 |
| 7 | 4 |
Daniel Roberto
M
40-49
|
45.05 |
| 8 | 5 |
Wayne Kline
M
60-69
|
45.03 |
| 9 | 4 |
Jana Snider
F
30-39
|
45.02 |
| 10 | 6 |
Jason Dunsavage
M
40-49
|
45 |
| 11 | 5 |
Candice Lockard
F
40-49
|
40.15 |
| 12 | 7 |
Philip Yeager
M
30-39
|
40.12 |
| 13 | 8 |
Sean ONeil
M
30-39
|
40.09 |
| 14 | 9 |
Jacob Taciuch
M
20-29
|
40.06 |
| 15 | 10 |
Mikhail Petrovskikh
M
40-49
|
40.05 |
| 16 | 11 |
Matt Smith
M
20-29
|
40.02 |
| 17 | 12 |
Glen Stone
M
40-49
|
40.01 |
| 18 | 13 |
Bill Sparling
M
60-69
|
40 |
| 19 | 6 |
Gaynor Bourgeois
F
40-49
|
35.13 |
| 20 | 14 |
Chris Stotler
M
40-49
|
35.1 |
| 21 | 15 |
Mitch Hawbaker
M
50-59
|
35.07 |
| 22 | 16 |
Will Guidi
M
30-39
|
35.06 |
| 23 | 7 |
Jacqueline Ong
F
50-59
|
35.05 |
| 24 | 17 |
Jim Nye
M
30-39
|
35.04 |
| 25 | 8 |
Amanda Mock
F
20-29
|
35.03 |
| 26 | 9 |
Marit Janse
F
50-59
|
35 |
| 27 | 18 |
Garth Wagoner
M
30-39
|
30.25 |
| 28 | 19 |
Brian DeCarli
M
40-49
|
30.23 |
| 29 | 10 |
Judy Rupp
F
50-59
|
30.22 |
| 30 | 11 |
Eve Mills
F
50-59
|
30.21 |
| 31 | 20 |
Matt Strickler
M
40-49
|
30.2 |
| 32 | 21 |
George Barido
M
40-49
|
30.18 |
| 33 | 22 |
Mike Dolin
M
30-39
|
30.18 |
| 34 | 12 |
Karen Donohue
F
40-49
|
30.17 |
| 35 | 23 |
Mike Acker
M
40-49
|
30.15 |
| 36 | 24 |
Walter Megonigal
M
40-49
|
30.14 |
| 37 | 25 |
J Carroll
M
40-49
|
30.13 |
| 38 | 13 |
Brittany Lease
F
30-39
|
30.12 |
| 39 | 14 |
Connie Milligan
F
40-49
|
30.11 |
| 40 | 15 |
Hazel Frederick
F
40-49
|
30.1 |
| 41 | 26 |
Mark Tinsley
M
40-49
|
30.09 |
| 42 | 16 |
Lindsay Wimer
F
30-39
|
30.08 |
| 43 | 27 |
Christopher Johnson
M
40-49
|
30.07 |
| 44 | 17 |
Chelsea Guiseppi
F
20-29
|
30.06 |
| 45 | 28 |
Gregory Harding
M
60-69
|
30.05 |
| 46 | 29 |
Lynn Harding
M
60-69
|
30.03 |
| 47 | 18 |
Amy Evans
F
30-39
|
30 |
We only include individuals who completed more than 26.2 miles for timed events.


